Our Solutions
Webreports NG
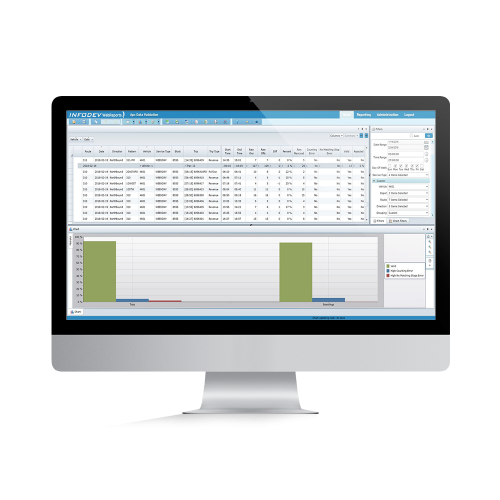
Our Webreports NG suite offers many tools to monitor and analyze everyday transit operations, making it an essential tool for Smart Cities. A large variety of key performance indicators (KPIs), selected in collaboration with experts and clients throughout the years, are available in our list of “performance reports” to highlight the trends in your data.
Webreports NG can be used to analyze the data provided by Infodev’s Automatic Passenger Counting system or bought as a standalone and combined with the APC system you are currently using. Whatever option you choose, you will be sure to get the most out of your data!
Insoft Research
Webreports NG's Features
You can choose to use our performance reports to understand your transit system in reality. We also give you the option to create your own personalised report, you can control the level of detail and data representation, saving precious when analyzing/minig data.

Advanced filtering, grouping and sorting options available

Multiple security features

User-friendly navigation and interface

Base package includes over fifteen standard reports

Customizable reports

Easy visualization and comprehension of data

Easy configuration
Webreports NG
Reports available
Our WebReports NG suite offers many tools to monitor and analyze every day bus and train operations, making it an essential tool for Smart Cities. With this new technology, you will be able to see the occupancy of each route or pattern during the day, measure dwell time at each stop and major point across the city, get APC status report, resulting in an increase efficiency in fleet maintenance and operations and much more.
Ridership analysis
Crucial data regarding the passengers and their habits in regards to the transit operations.
It gives you access to summaries concerning the boarding and alighting during the day. It also present detailed information at the stop level for each event that has been sampled.
It gives you access to summaries concerning the Ins and Outs of passengers for every period of a day, which are Pre-AM, AM Peak, Midday, PM Peak, Evening and Night.
This will allow transit management to better analyze the affluence of a pattern over a day, helping them to assign the right number of vehicles per period.
It present detailed informations at the stop level for each event that has been sampled by every vehicle with APC data equipment.
The purpose of this report is wide. It is the most detailed report, allowing you to extract almost any information you want from it by customizing the groupings and summary calculations.
Productivity analysis
These different reports will allow your transit operation to see if there are tendencies for certain pattern or route’s coverage, evaluate the productivity of a route for every route’s patterns, analyze the ridership of every trip scheduled by route and evaluate the productivity of a route for every time period.
This report provides scheduled and sampled trips count for every service day type by route and pattern.
The purpose of this report is to see if there are tendencies for certain pattern or route’s coverage.
This report provides productivity information (Ons, Offs, Ridership, Vehicle Hours, etc.) for every time period by route and direction.
The purpose of this report is to evaluate the productivity of a route for every time periods.
This report provides ridership statistics for every scheduled trip.
The purpose of this report is to analyze the ridership of every trip scheduled by route.
This report provides productivity information (Ons, Offs, Ridership, Vehicle Hours, etc.) for every time periods: pre-AM, AM Peak, Midday, PM Peak, Evening and Night by route and direction.
The purpose of this report is to evaluate the productivity of a route for every time periods.
Standard time adherence reports
The purpose of those reports is to evaluate the running time efficiency and adherence information depending on the period of the day.
It provides informations about the schedule adherence of each stop or trip sampled and statistics on the running time of vehicles.
This report provides information on the schedule adherence of each stop sampled by classifying them in different categories: Very Early, Early, On-Time, Late and Very Late.
The purpose of this report is to be able to analyze the behavior of certain blocks and trips and see if there are tendencies in the schedule adherence.
This report provides statistics on the running time of vehicles for a given route and pattern between two selected stops for every period of a day.
The purpose of this report is to be able to evaluate the running time efficiency depending on the period of the day.
Diagnostic Reports
The diagnostic reports enable the user to analyze data anomalies and be able to diagnose potential loggers, booking and assignations problems.
This report provides more detailed information on every trip and indicates whether or not they’ve been rejected and the reason for rejection. The data related to the rejected trips won’t be used in all other reports.
The purpose of this report is to enable the user to analyze many problems that can occur in the transit.
This report provides in-depth diagnostic information for every vehicle on every day of the specified date range.
The purpose of this report is to analyze every vehicle’s data to find anomalies and be able to diagnose potential loggers, booking and assignations problems.
Reliability Evaluation
The Reliability Analysis allow the transit organization to make more enlightened decisions concerning the APC system coverage on vehicles, trips and block.
The reports provide a quick overview of every vehicle’s reliability given the amount of sampled data available, they give a more detailed view of every vehicle’s operational data and informations on every trip’s and block’s coverage per service day type.
This report provides operational information for each vehicle and every day of the specified date range.
The purpose of this report is to provide a quick overview of every vehicle’s reliability given the amount of sampled data available.
This report provides detailed information about routes ran by every vehicle for every day of the specified date range.
The purpose of this report is to provide a more detailed view of every vehicle’s operational data.
This report provides information on every trip’s coverage per block and service day type.
The purpose of this report is to show a more detailed version of block coverage. It can give some explanations in cases of anomalies observed in the block coverage report. (e.g. certain blocks always seem to be partially covered. Using this report, it is possible to get the information about which trip are not covered.)
This report provides information on block’s coverage per service day type.
The purpose of this report is to see if there are tendencies for certain block’s coverage and modify them if necessary. It is also used by the traffic dispatcher team to assign vehicles equipped with APC system to the blocks with the lowest coverage to get the most accurate passenger counting statistics over the transit.
Insoft Research
know more about our real time solution
This latest Insoft’s web application allows transit operation teams to visualize the fleet in real time. Various data about location, schedule adherence and occupancy rates are displayed on a city map in real time.
